loki是主服务器,负责存储日志和处理查询
promtail是代理,负责收集日志并将其发送给 loki
Grafana用于 UI 展示
1、官方网站上下载对应的loki和promatail版本包
https://github.com/grafana/loki/releases/
打开链接后,往下翻

点击Show all 56 assets后,往下翻,找到对应你操作系统的包
我的操作是cenots7.5
所以下载的是这两个

2、下载后上传至服务器上,先解压promatail压缩包
unzip promtail-linux-amd64.zip
然后去下载官网的promtail-local-config.yaml配置文件
如果下载失败,可以在浏览器上打开,只需去掉下面的前面的wget,即可
wget https://raw.githubusercontent.com/grafana/loki/v2.2.1/cmd/promtail/promtail-local-config.yaml
看下promtail-local-config.yaml配置文件
默认不用修改

然后去启动promtail
注意这个启动方式,服务器关机后,服务会丢失
./promtail-linux-amd64 -config.file=promtail-local-config.yaml
(启动后新开一个窗口,因为是直接启动,并没有从后台启动,CTRL+C会停止服务)

也可以写成系统服务
vim /etc/systemd/system/promtail.service
[Unit]
Description=promtail
After=network.target
[Service]
ExecStart=/home/promtail-linux-amd64 \
-config.file=/home/promtail-local-config.yaml &>> /opt/logs/promtail-9080.log
Restart=on-failure
[Install]
WantedBy=multi-user.target
注意promtail-linux-amd64和promtail-local-config.yaml修改成对应的实际存储路径
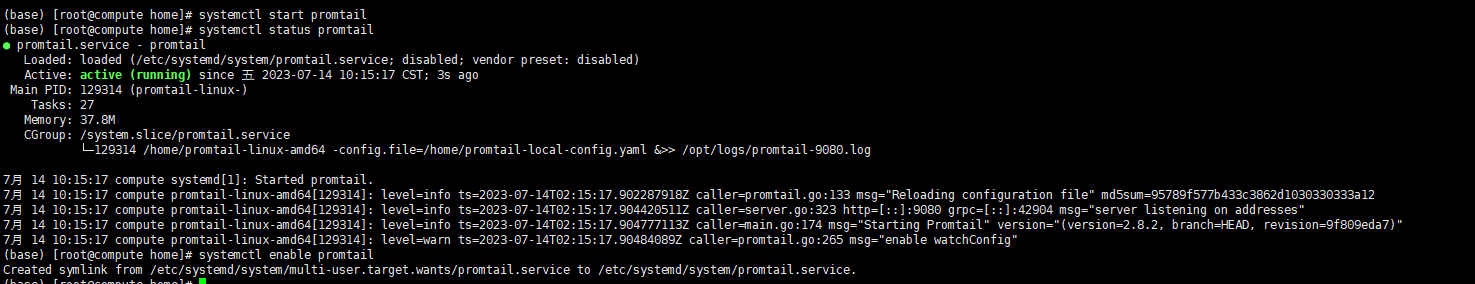
systemctl start promtail
systemctl status promtail
systemctl enable promtail
访问http://localhost:3100/api/prom/label
3、解压loki,并安装使用
unzip loki-linux-amd64
然后去下载官网的promtail-local-config.yaml配置文件
如果下载失败,可以在浏览器上打开,只需去掉下面的前面的wget,即可
wget https://raw.githubusercontent.com/grafana/loki/v2.2.1/cmd/loki/loki-local-config.yaml
看下loki-local-config.yaml配置文件

默认不用修改
然后去启动loki-local-config.yaml
注意这个启动方式,服务器关机后,服务会丢失
./loki-linux-amd64 -config.file=loki-local-config.yaml
(启动后新开一个窗口,因为是直接启动,并没有从后台启动,CTRL+C会停止服务)
也可以写成系统服务
vim /etc/systemd/system/loki.service
[Unit]
Description=loki
After=network.target
[Service]
ExecStart=/home/loki-linux-amd64 -config.file=/home/loki-local-config.yaml &>> /opt/logs/loki-3100.log
Restart=on-failure
[Install]
WantedBy=multi-user.target
注意loki-linux-amd64和loki-local-config.yaml修改成对应的实际存储路径
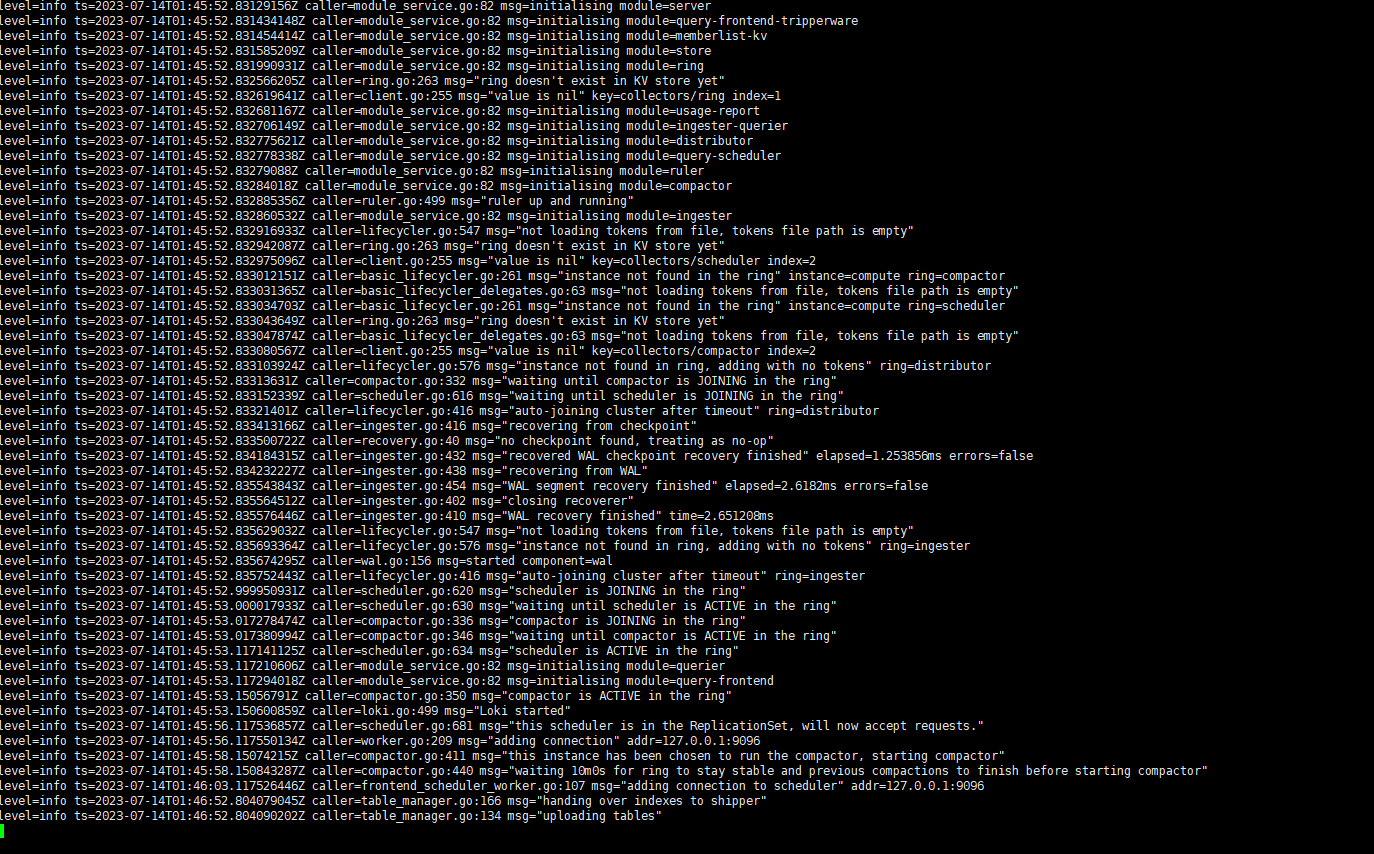
systemctl start loki
systemctl status loki
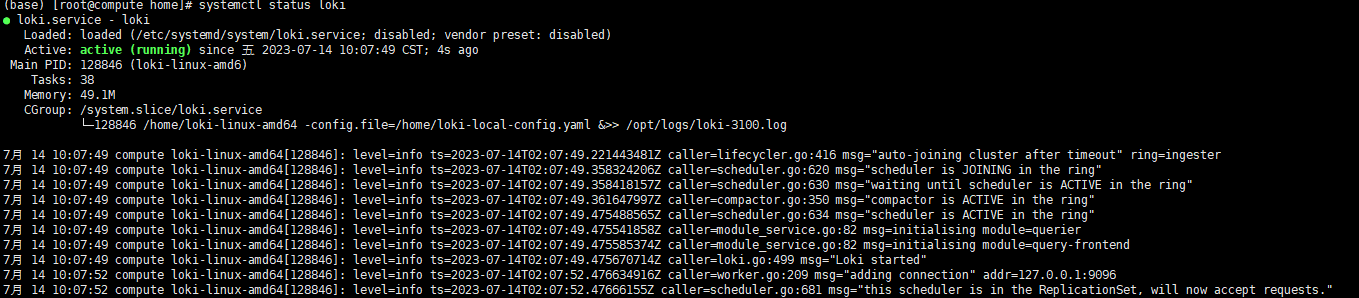
systemctl enable loki
访问下http://localhost:3100/metrics
4、通过docker安装granfana和prometheus
(安装docker,可以参考这篇博客https://www.cnblogs.com/likecoke/p/13630764.html)
拉取granfana10.0.2版本
docker pull grafana/grafana:10.0.2
启动grafana容器
docker run -d --name=grafana -p 3000:3000 grafana/grafana:10.0.2
拉取prometheus镜像
docker pull prom/prometheus
新建目录prometheus,编辑配置文件prometheus.yml
mkdir /opt/prometheus
cd /opt/prometheus/
vim prometheus.yml
global:
scrape_interval: 60s
evaluation_interval: 60s
scrape_configs:
- job_name: prometheus
static_configs:
- targets: ['localhost:9090']
labels:
instance: prometheus
scrape_configs:
- job_name: loki
static_configs:
- targets: ['192.168.1.56:3100']
labels:
instance: loki
把prometheus和loki的配置都写在prometheus.yml配置文件里,
注意:修改IP地址,这里的192.168.1.56是宿主机的IP
启动prometheus容器
docker run -d --name prometheus --restart=always -p 9090:9090 -v /opt/prometheus/prometheus.yml:/etc/prometheus/prometheus.yml prom/prometheus
5、通过granfana去添加上Loki
访问服务器IP:3000
默认用户和密码都为admin
首次登录会修改密码
登录后,依次点击Home adminostration
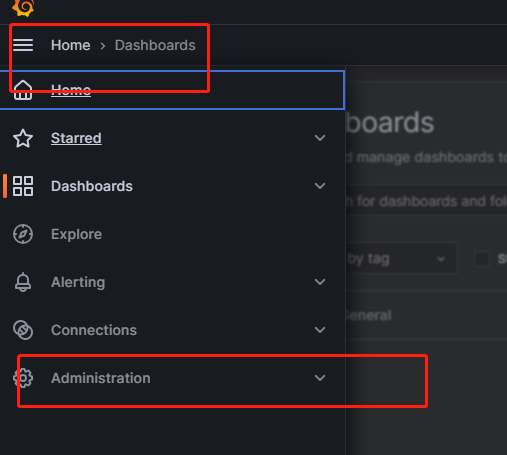
然后点击Data sources 去添加新的数据源

往下翻,找到Loki,点击

然后填写对应的信息
写入名字,Loki的访问地址

往下翻,找到save&test