一、安装
npm i echarts--save
二、引入
//全局引入
import echarts from 'echarts'
Vue.prototype.$echarts = echarts

//局部【这里使用局部引入】
import echarts from 'echarts';
三、代码
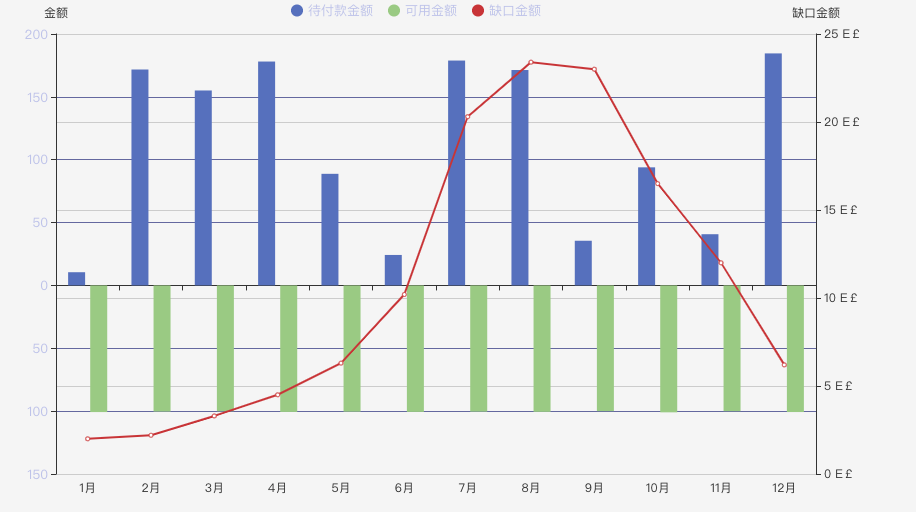
  1 <template>
  2   <!-- 容器 -->
  3   <div id="cylinderEcharts" ref="cylinderEcharts" style="width:900px;height:500px"></div>
  4 </template>
  5
  6 <script>
  7 import echarts from 'echarts';
  8 export default {
  9 data() {
 10   return{
 11      // 正负柱状图
 12       zhengfuZhu: {},
 13       data1: [],
 14       data4: [],
 15       xAxisData1: [],//横轴刻度
 16       seriesLabel: { //柱子上的字体
 17         show: false,
 18         position: 'outside',
 19         color: '#BEC3EB',
 20       },
 21       seriesEmphasis: { //
 22         itemStyle: {
 23           shadowBlur: 20,
 24           shadowColor: 'rgba(0,0,0,0.3)'
 25         }
 26       },
 27       seriesBarWidth: 17,//设置柱子粗细
 28       seriesYears: ['2022', '2023'],
 29       seriesColors: ['#5871c0', '#9eca7f', '#f3c96b', '#de6e6a'],
 30   }
 31 },
 32 mounted() {
 33   for (let i = 0; i < 12; i++) {
 34       this.xAxisData1.push(i + 1 + "月");
 35       this.data1.push(+(Math.random() * 200).toFixed(2));
 36       this.data4.push(-(Math.random() + 100).toFixed(2));
 37     }
 38     this.$nextTick(() => { //加这这防止容器还未出来,就去初化下,会报如下错误
 39       this.drawLine();
 40     })
 41 },
 42 methods: {
 43    drawLine(){
 44     this.zhengfuZhu = {
 45       legend: {
 46         data: ['待付款金额','可用金额','缺口金额'],
 47         // right: '10%',
 48         icon: 'circle',
 49         textStyle: {
 50           color: ' #BEC3EB',
 51           fontSize: 13
 52         },
 53         itemWidth: 12, // 设置宽度
 54         itemHeight: 12, // 设置高度
 55         itemGap: 15,
 56         formatter: function (value) {
 57           return value
 58         },
 59       },
 60       // tooltip: {
 61       //   formatter: function (params) {
 62       //     var value = params.value;
 63       //     //首先要看看params是怎样的数据结构,里面有什么内容;
 64       //     if (value < 0) {
 65       //         value = -value
 66       //     }
 67       //     return params.seriesName + ':' + value + ''
 68       //   }
 69       // },
 70       tooltip: {
 71         trigger: 'axis',
 72         axisPointer: {
 73           type: 'cross',
 74           crossStyle: {
 75             color: '#999'
 76           }
 77         }
 78       },
 79       xAxis: {
 80         data: this.xAxisData1,
 81         type: 'category',
 82         axisPointer: {
 83           type: 'shadow'
 84         },
 85         // splitArea: { show: false },
 86         // axisLabel: {
 87         //   textStyle: {
 88         //     color: '#5871c0',
 89         //     fontSize: 13
 90         //   },
 91         // },
 92       },
 93       yAxis: [
 94         {
 95           type: 'value',
 96           name: '金额',
 97           // splitNumber: 10,
 98           splitLine: {
 99             show: true,
100             lineStyle: {
101               color: '#6469A1',
102               width: 1,
103               type: 'solid'
104             }
105           },
106           axisLabel: {
107             formatter: function (value) {
108               if (value < 0) {
109                   value = -value
110               } else {
111                   value = value
112               }
113               return value + ''
114             },
115             textStyle: {
116                 color: ' #BEC3EB',
117                 fontSize: 13
118             },
119           },
120         },
121         {
122           type: 'value',
123           name: '缺口金额',
124           min: 0,
125           max: 25,
126           interval: 5,
127           axisLabel: {
128             formatter: '{value} E£'
129           }
130         }
131       ],
132       grid: {
133         bottom: 25,
134         top: 35,
135         right: 50
136       },
137       series: [
138         {
139           name: '待付款金额',
140           type: 'bar',
141           stack: 'one',
142           label: this.seriesLabel,
143           emphasis: this.seriesEmphasis,
144           data: this.data1,
145           barWidth: this.seriesBarWidth,
146           itemStyle: {
147             // 柱状图颜色
148             color: this.seriesColors[0]
149           }
150         },
151         {
152           name: '可用金额',
153           type: 'bar',
154           label: this.seriesLabel,
155           stack: 'two',
156           emphasis: this.seriesEmphasis,
157           barWidth: this.seriesBarWidth,
158           data: this.data4,
159           itemStyle: {
160             // 柱状图颜色
161             color: this.seriesColors[1]
162           }
163         },
164         {
165           name: '缺口金额',
166           type: 'line',
167           yAxisIndex: 1,
168           tooltip: {
169             valueFormatter: function (value) {
170               return value + ' E£';
171             }
172           },
173           data: [2.0, 2.2, 3.3, 4.5, 6.3, 10.2, 20.3, 23.4, 23.0, 16.5, 12.0, 6.2]
174         }
175       ],
176     }
177     console.log('this.$refs.cylinderEcharts--',document.getElementById('cylinderEcharts'));
178     var myChart2 = echarts.init(this.$refs.cylinderEcharts);//echarts.init(document.getElementById('cylinderEcharts'));
179     myChart2.setOption(this.zhengfuZhu);
180   },
181 }
182
183 }
184
185
186 </script>
效果图如下