十年河东,十年河西,莫欺少年穷
学无止境,精益求精
接着上一篇博客: wpf + MaterialDesign + Prism8 实现导航功能
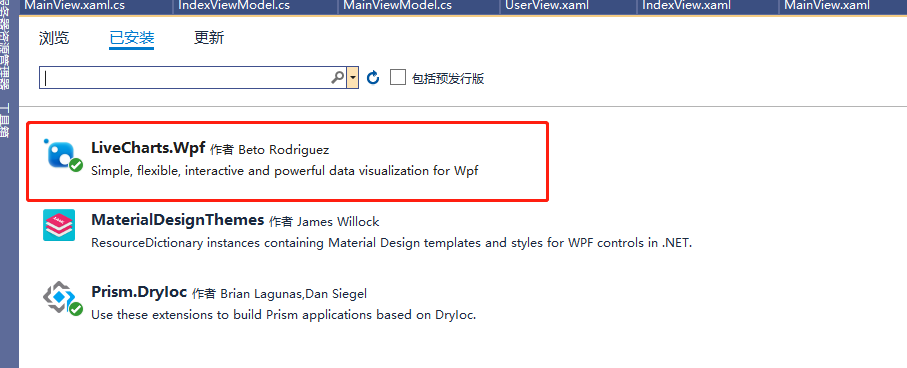
1、项目引入图表包
2、定义用户控件 IndexView 的 IndexViewModel,如下


using LiveCharts;
using Prism.Mvvm;
using System;
using System.Collections.Generic;
using System.Collections.ObjectModel;
using System.Text;

namespace WpfApp.ViewModels
{
    public class IndexViewModel : BindableBase
    {
        private ChartValues<int> dataXCenters;

        public ChartValues<int> DataXCenters
        {
            get { return dataXCenters; }
            set { dataXCenters = value; RaisePropertyChanged(); }
        }

        /// <summary>
        ///
        /// </summary>
        private ChartValues<int> dataYCenters;

        public ChartValues<int> DataYCenters
        {
            get { return dataYCenters; }
            set { dataYCenters = value; RaisePropertyChanged(); }
        }

        private ObservableCollection<IndexXamlModel> indexData;

        public ObservableCollection<IndexXamlModel> IndexData
        {
            get { return indexData; }
            set { indexData = value; RaisePropertyChanged(); }
        }


        public IndexViewModel()
        {
            DataXCenters = new ChartValues<int>() { 1, 2, 3, 4, 5, 6, 2, 3, 2, 2, 3, 4, 6, 2, 3, 4, 1, 2, 3, 4, 5, 6, 2, 3, 2, 2, 3, 4, 6, 2, 3, 4 };
            DataYCenters = new ChartValues<int>() { 2, 4, 6, 8, 10, 12, 18, 19, 16, 12, 13, 14, 18, 10, 12, 12, 2, 4, 6, 8, 10, 12, 18, 19, 16, 12, 13, 14, 18, 10, 12, 12 };

            //
            IndexData = new ObservableCollection<IndexXamlModel>();
            for (int i = 0; i < 10; i++)
            {
                IndexData.Add(new IndexXamlModel() { count = (i + 1) * 3, title = (i + 1) + "级传销商" });
            }
        }
    }
    public class IndexXamlModel
    {
        public string title { get; set; }
        public int count { get; set; }
    }
}
3、IndexView.Xaml 如下
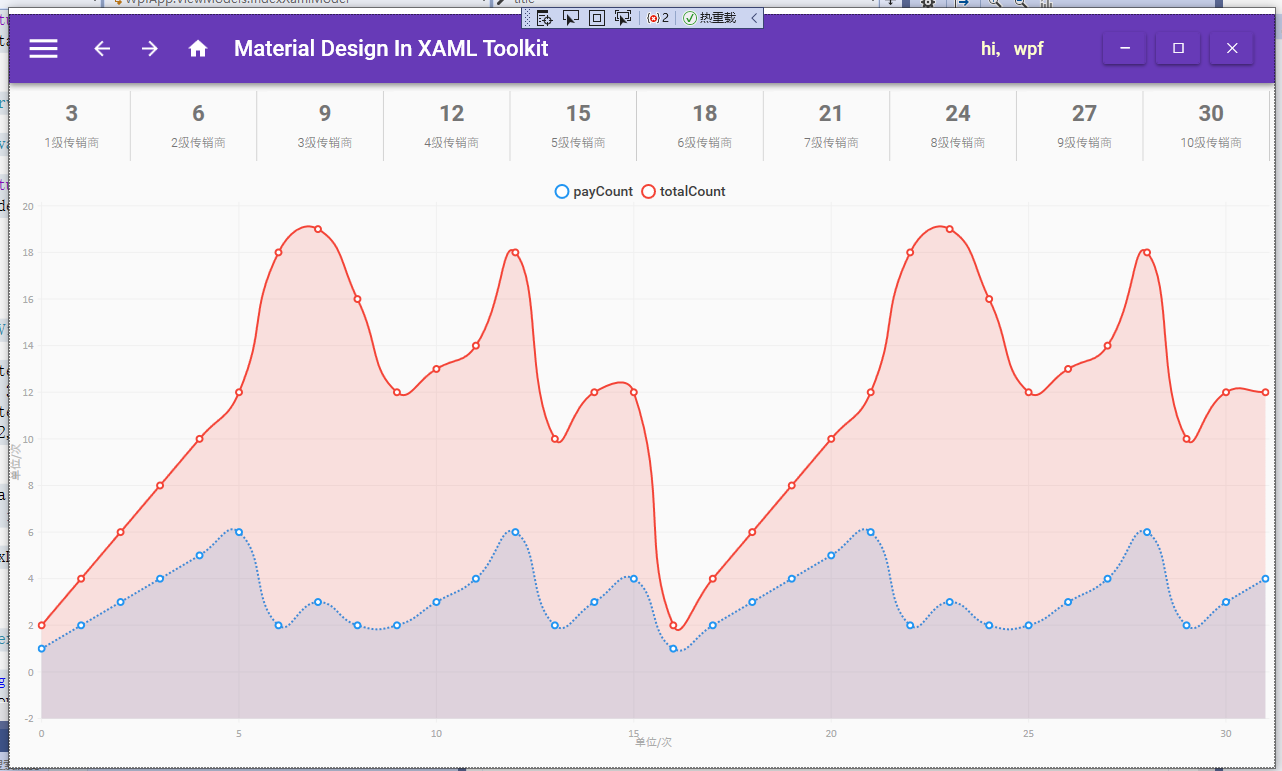
<UserControl x:Class="chengxiangSite.UserControls.IndexView"
             xmlns="http://schemas.microsoft.com/winfx/2006/xaml/presentation"
             xmlns:x="http://schemas.microsoft.com/winfx/2006/xaml"
             xmlns:mc="http://schemas.openxmlformats.org/markup-compatibility/2006"
             xmlns:d="http://schemas.microsoft.com/expression/blend/2008"
             xmlns:local="clr-namespace:chengxiangSite.UserControls" xmlns:lvc="clr-namespace:LiveCharts.Wpf;assembly=LiveCharts.Wpf"
             mc:Ignorable="d"
             d:DesignHeight="450" d:DesignWidth="800">
    <Grid>
        <Grid.RowDefinitions>
            <RowDefinition Height="auto"/>
            <RowDefinition/>
        </Grid.RowDefinitions>
        <ItemsControl Grid.Row="0" ItemsSource="{Binding IndexData}">
            <ItemsControl.ItemsPanel>
                <ItemsPanelTemplate>
                    <UniformGrid Columns="10"/>
                </ItemsPanelTemplate>
            </ItemsControl.ItemsPanel>
            <ItemsControl.ItemTemplate>
                <DataTemplate>
                    <Border BorderBrush="#ccc" BorderThickness="0,0,1,0" Margin="5,8" Height="70" Background="#fafafa"  >
                        <Grid  DockPanel.Dock="Right">
                            <Grid.RowDefinitions>
                                <RowDefinition Height="auto" />
                                <RowDefinition Height="auto" />
                            </Grid.RowDefinitions>
                            <Grid.ColumnDefinitions>
                                <ColumnDefinition/>
                            </Grid.ColumnDefinitions>
                            <TextBlock Text="{Binding count}" HorizontalAlignment="Center" Margin="0,9"  FontWeight="Bold" Foreground="#747474" FontSize="22"/>
                            <TextBlock Grid.Row="1" Text="{Binding title}" FontSize="12" HorizontalAlignment="Center" FontWeight="Light" Foreground="#747474"/>

                        </Grid>
                    </Border>
                </DataTemplate>
            </ItemsControl.ItemTemplate>
        </ItemsControl>


        <lvc:CartesianChart Grid.Row="1" LegendLocation="Top" Margin="0,12">
            <lvc:CartesianChart.Series>
                <!--设置Series的类型为 Line 类型, 该类型提供了一些折线图的实现-->
                <lvc:LineSeries LineSmoothness="1" DataLabels="False" StrokeDashArray="1"  Title="payCount"  Values="{Binding DataXCenters}"/>
                <lvc:LineSeries LineSmoothness="1" DataLabels="False"   Title="totalCount"     Values="{Binding DataYCenters}"/>
            </lvc:CartesianChart.Series>
            <!--定义Y轴-->
            <lvc:CartesianChart.AxisY>
                <!-- 定义Y轴名称 -->
                <lvc:Axis Title="单位/次"></lvc:Axis>
            </lvc:CartesianChart.AxisY>

            <!--定义X轴-->
            <lvc:CartesianChart.AxisX>
                <!-- 定义X轴名称 -->
                <lvc:Axis Title="单位/次"></lvc:Axis>
            </lvc:CartesianChart.AxisX>
            <!--<lvc:CartesianChart.VisualElements>
                <lvc:VisualElement X="{Binding MinX}" Y="{Binding MaxY}">
                    <lvc:VisualElement.UIElement>
                        <TextBlock Foreground="Green">
                            Hello!, this is a note merged in the chart.
                        </TextBlock>
                    </lvc:VisualElement.UIElement>
                </lvc:VisualElement>
            </lvc:CartesianChart.VisualElements>-->

        </lvc:CartesianChart>
    </Grid>
</UserControl>
效果如下:
@天才卧龙的博客