图表代码如下:
#!/usr/bin/env python
from openpyxl import Workbook
from openpyxl.chart import (
Reference,
Series,
BarChart
)
book = Workbook()
sheet = book.active
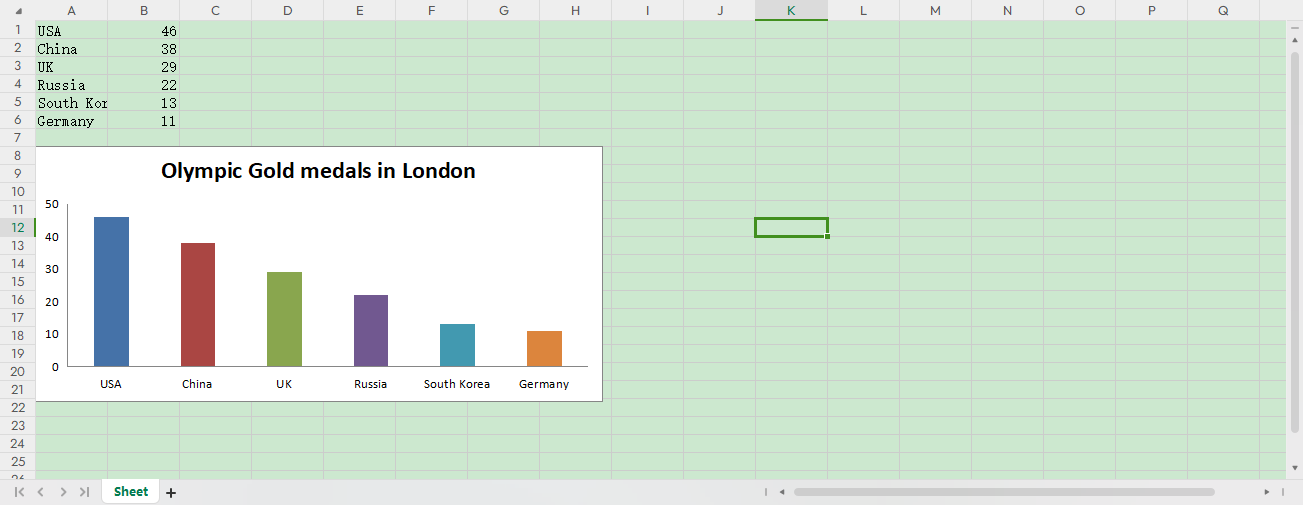
rows = [
("USA", 46),
("China", 38),
("UK", 29),
("Russia", 22),
("South Korea", 13),
("Germany", 11)
]
for row in rows:
sheet.append(row)
data = Reference(sheet, min_col=2, min_row=1, max_col=2, max_row=6)
categs = Reference(sheet, min_col=1, min_row=1, max_row=6)
chart = BarChart()
chart.add_data(data=data)
chart.set_categories(categs)
chart.legend = None
chart.y_axis.majorGridlines = None
chart.varyColors = True
chart.title = "Olympic Gold medals in London"
sheet.add_chart(chart, "A8")
book.save("bar_chart.xlsx")
实现效果如下: