Nginx loki监控日志的学习
背景
学习自:
https://mp.weixin.qq.com/s/Qt1r7vzWvCcJpNDilWHuxQ
增加了一些自己的理解
第一部分nginx日志的完善
在logformat的后面增加一个:
log_format json_analytics escape=json '{'
                            '"msec": "$msec", ' # request unixtime in seconds with a milliseconds resolution
                            '"connection": "$connection", ' # connection serial number
                            '"connection_requests": "$connection_requests", ' # number of requests made in connection
                    '"pid": "$pid", ' # process pid
                    '"request_id": "$request_id", ' # the unique request id
                    '"request_length": "$request_length", ' # request length (including headers and body)
                    '"remote_addr": "$remote_addr", ' # client IP
                    '"remote_user": "$remote_user", ' # client HTTP username
                    '"remote_port": "$remote_port", ' # client port
                    '"time_local": "$time_local", '
                    '"time_iso8601": "$time_iso8601", ' # local time in the ISO 8601 standard format
                    '"request": "$request", ' # full path no arguments if the request
                    '"request_uri": "$request_uri", ' # full path and arguments if the request
                    '"args": "$args", ' # args
                    '"status": "$status", ' # response status code
                    '"body_bytes_sent": "$body_bytes_sent", ' # the number of body bytes exclude headers sent to a client
                    '"bytes_sent": "$bytes_sent", ' # the number of bytes sent to a client
                    '"http_referer": "$http_referer", ' # HTTP referer
                    '"http_user_agent": "$http_user_agent", ' # user agent
                    '"http_x_forwarded_for": "$http_x_forwarded_for", ' # http_x_forwarded_for
                    '"http_host": "$http_host", ' # the request Host: header
                    '"server_name": "$server_name", ' # the name of the vhost serving the request
                    '"request_time": "$request_time", ' # request processing time in seconds with msec resolution
                    '"upstream": "$upstream_addr", ' # upstream backend server for proxied requests
                    '"upstream_connect_time": "$upstream_connect_time", ' # upstream handshake time incl. TLS
                    '"upstream_header_time": "$upstream_header_time", ' # time spent receiving upstream headers
                    '"upstream_response_time": "$upstream_response_time", ' # time spend receiving upstream body
                    '"upstream_response_length": "$upstream_response_length", ' # upstream response length
                    '"upstream_cache_status": "$upstream_cache_status", ' # cache HIT/MISS where applicable
                    '"ssl_protocol": "$ssl_protocol", ' # TLS protocol
                    '"ssl_cipher": "$ssl_cipher", ' # TLS cipher
                    '"scheme": "$scheme", ' # http or https
                    '"request_method": "$request_method", ' # request method
                    '"server_protocol": "$server_protocol", ' # request protocol, like HTTP/1.1 or HTTP/2.0
                    '"pipe": "$pipe", ' # "p" if request was pipelined, "." otherwise
                    '"gzip_ratio": "$gzip_ratio", '
                    '"http_cf_ray": "$http_cf_ray"'
                    '}';
然后日志修改为:
access_log /data/nginx/gscloudsu.log json_analytics ;
注意文件日志等属性.
重启ningx:
lsof -i:5000 |awk '{print $2}' |xargs kill -9
cd /data/nginx
./nginx -c 5000.conf
下载loki等组件
https://github.com/grafana/loki/releases/tag/v2.9.2

最新版本是 2.9.2 我这边下载了四个文件备用
promtail-linux-arm64.zip
promtail-linux-amd64.zip
loki-linux-arm64.zip
loki-linux-amd64.zip

将 x86的截止放到 /usr/bin 目录下面
scp loki-linux-amd64 /usr/bin/loki
scp promtail-linux-amd64 /usr/bin/promtail
解压缩开启服务等
下载loki的配置文件:
地址为:
https://raw.githubusercontent.com/grafana/loki/main/examples/getting-started/loki-config.yaml
详细内容为:
mkdir /etc/loki
cat >/etc/loki/loki.yaml <<EOF
---
server:
  http_listen_port: 3100
#memberlist:
#  join_members:
#    - loki:7946
schema_config:
  configs:
    - from: 2021-08-01
      store: tsdb
      object_store: s3
      schema: v12
      index:
        prefix: index_
        period: 24h
common:
  path_prefix: /loki
  replication_factor: 1
  storage:
    s3:
      endpoint: minio:9000
      insecure: true
      bucketnames: loki-data
      access_key_id: loki
      secret_access_key: supersecret
      s3forcepathstyle: true
  ring:
    kvstore:
      store: memberlist
ruler:
  storage:
    s3:
      bucketnames: loki-ruler
EOF

启动服务:
nohup /usr/bin/loki  -config.file=/etc/loki/loki.yaml -auth.enabled=false &
配置promtail
cat >/etc/loki/promtail.yaml <<EOF
server:
  http_listen_port: 9080
  grpc_listen_port: 0

positions:
  filename: /tmp/positions.yaml

clients:
  - url: http://127.0.0.1:3100/loki/api/v1/push

scrape_configs:
- job_name: nginx
  static_configs:
  - targets:
      - localhost
    labels:
      job: nginx_logs
      __path__: /data/nginx/gscloudsu.log
EOF

# 启动服务
nohup /usr/bin/promtail  -config.file=/etc/loki/promtail.yaml &
数据源以及grafana的dashboard
增加 loki的数据源
增加 12559 的 2022年版本的json导入文件
注意不能选择新版本的. 新版本换了数据源.

todo:
1. loki 设置密码
2. nginx 的geoip的设置
3. 学习另外一个springboot的监控指标
https://grafana.com/grafana/dashboards/17175-spring-boot-observability/
https://github.com/blueswen/spring-boot-observability
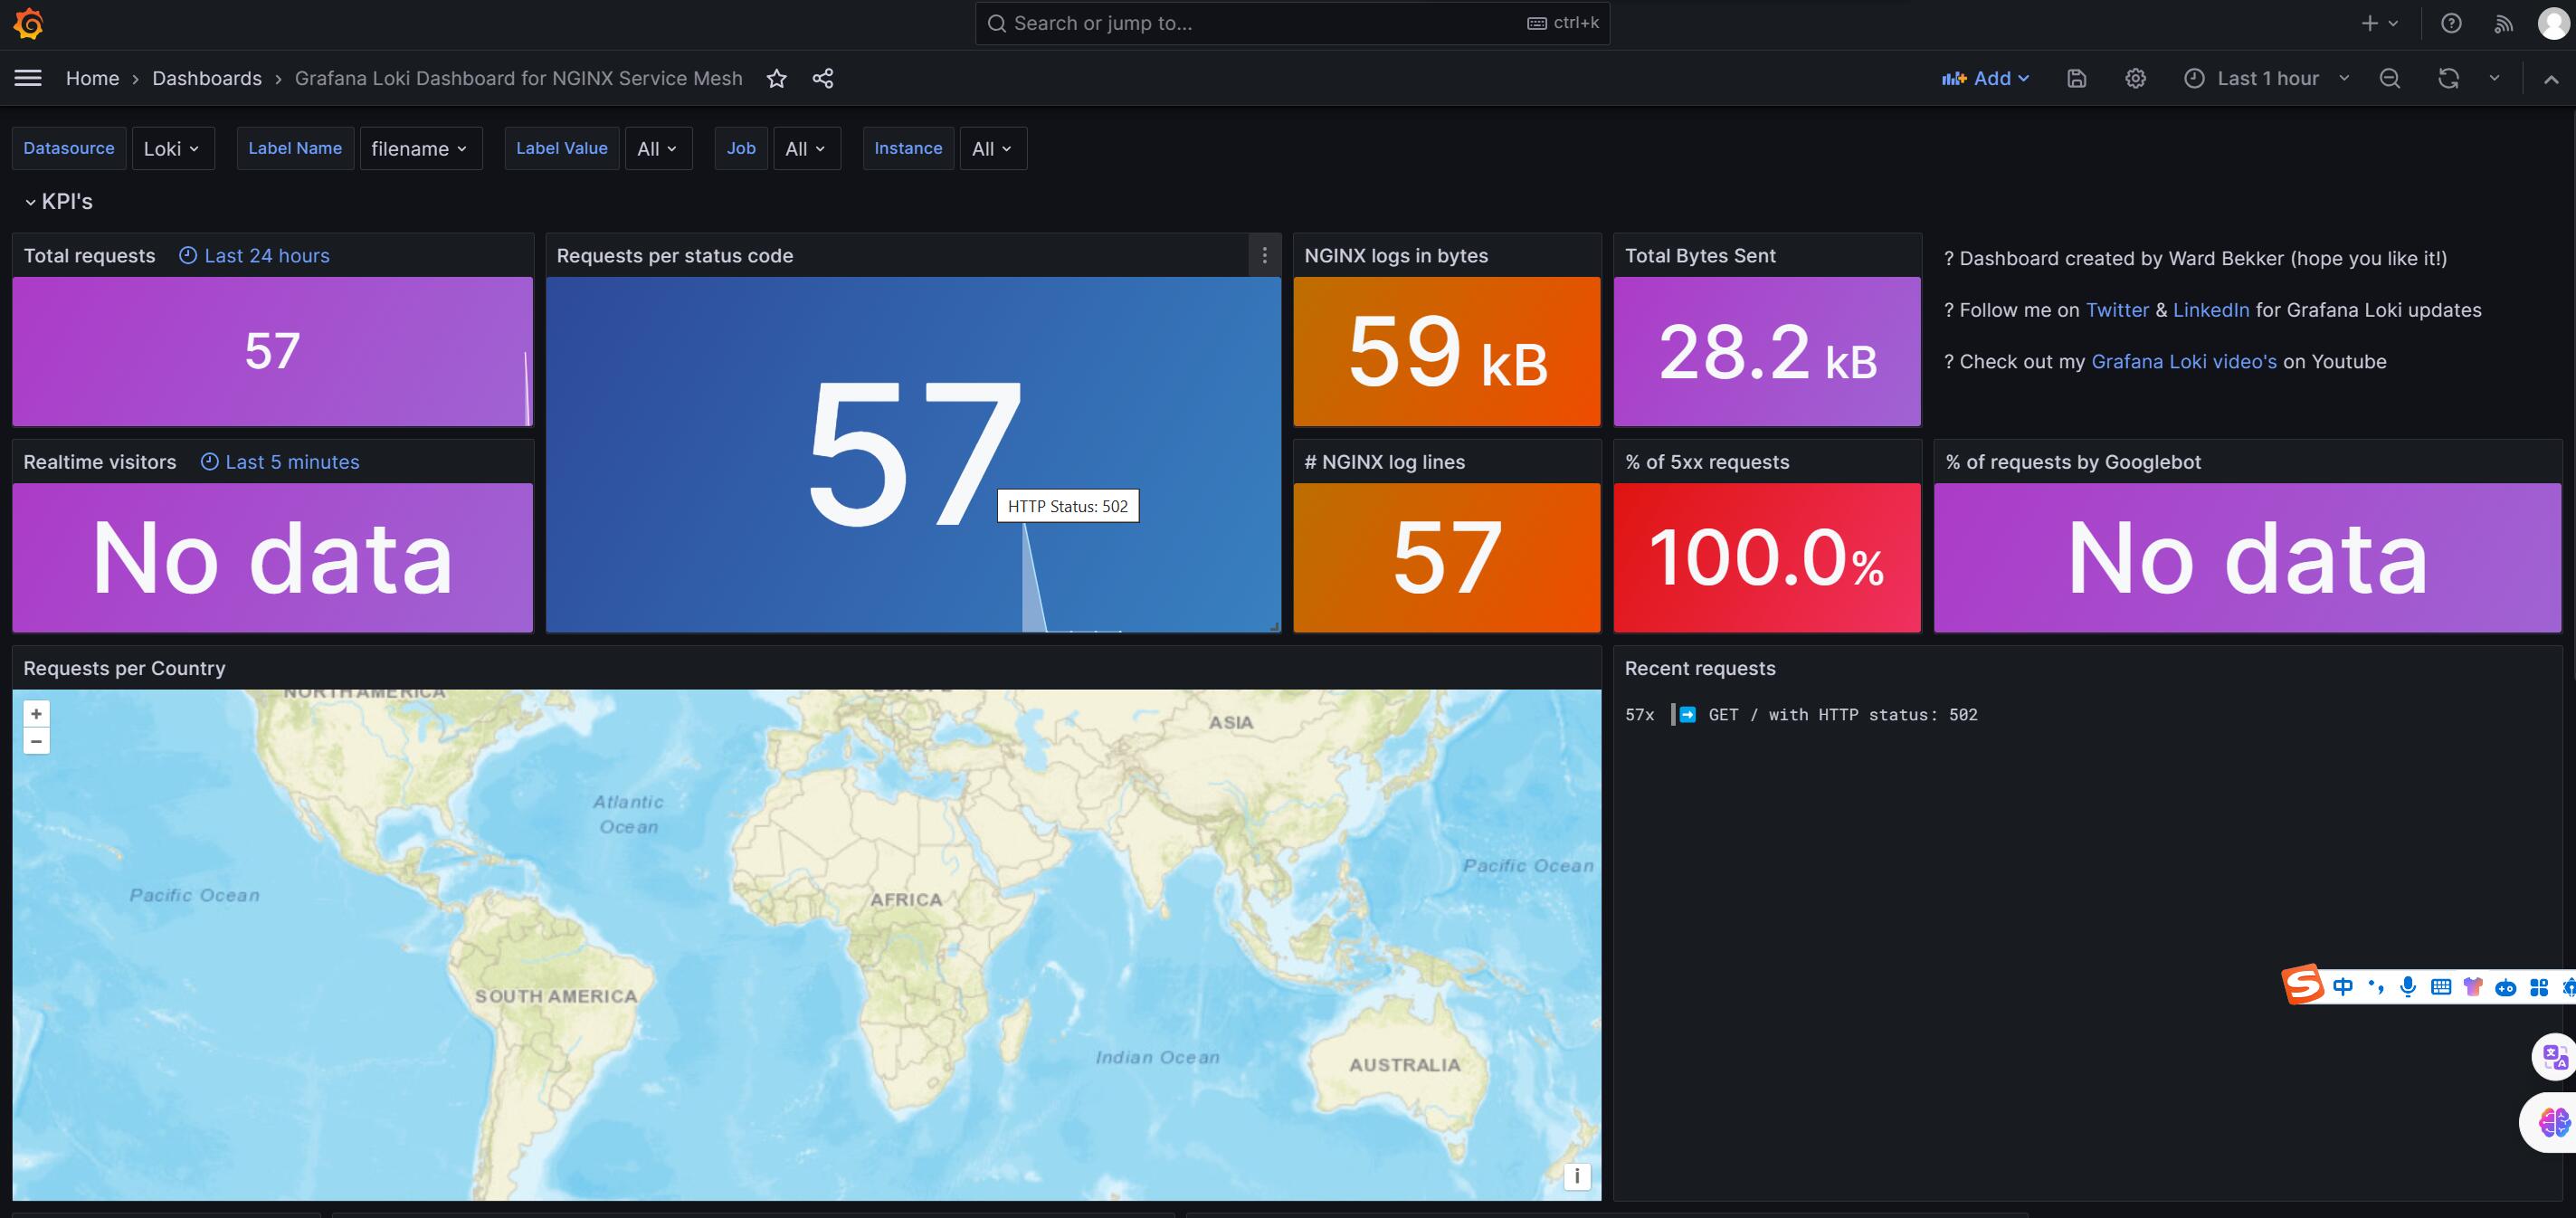
效果