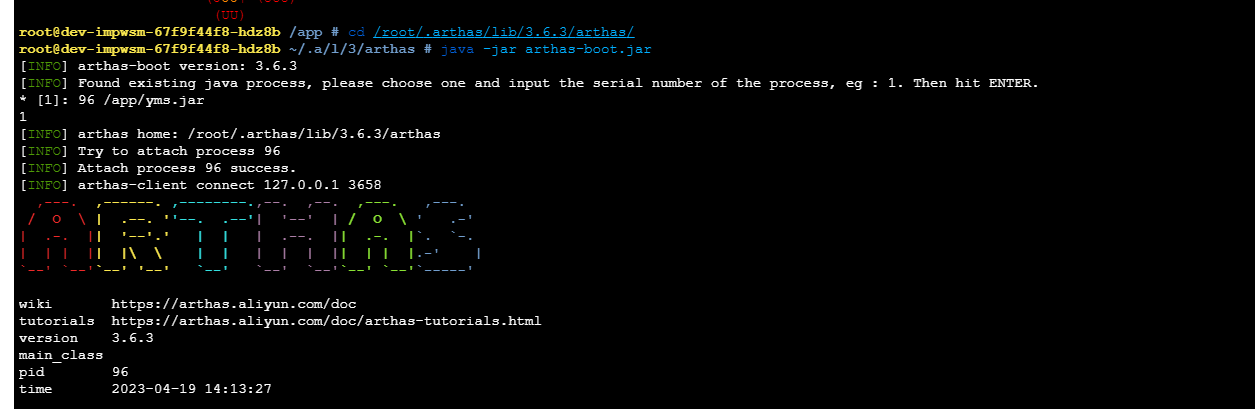
1.进入arthas
cd/root/.arthas/lib/3.6.3/arthas
java -jar arthas-boot.jar
选择/app/yms.jar
2.看方法入参,返回值,异常
示例:watch com.yonyou.imp.wsm.service.impl.WsmDtlServiceImpl insertMaterialsConsumption "{params,returnObj,throwExp}" -e -x 3
-x 3 指定的是对入参和返回值的遍历深度,目前最大为4
如果加上-e 只有在该方法发生异常时才会触发
3.看方法中的调用链路,查看耗时
示例:trace com.yonyou.imp.wsm.service.impl.WsmDtlServiceImpl insertMaterialsConsumption -n 1

-n 1的意思是只监控一次该方法,出发后即退出
如果想同时监控A方法和A方法中调用的B方法,需要另起一个终端
然后连接上之前的arthas telnet localhost 3658
最后在普通的trace命令后面加上 --listenerId 2

4.反编译代码
jad com.yonyou.imp.wsm.service.impl.WsmDtlServiceImpl insertMaterialsConsumption

如果不想看到classLoader 可以在jad后面加上--source-only
jad --source-only com.yonyou.imp.wsm.service.impl.WsmDtlServiceImpl insertMaterialsConsumption
5.关闭服务
stop
