初学Bokeh:绘制折线图【4】跬步
本例程来自于Bokeh的教程示例。
Step1:从bokeh.plotting库中引用函数figure()和show()
from bokeh.plotting import figure, show
Step2:定义需要显示的数据
# prepare some data
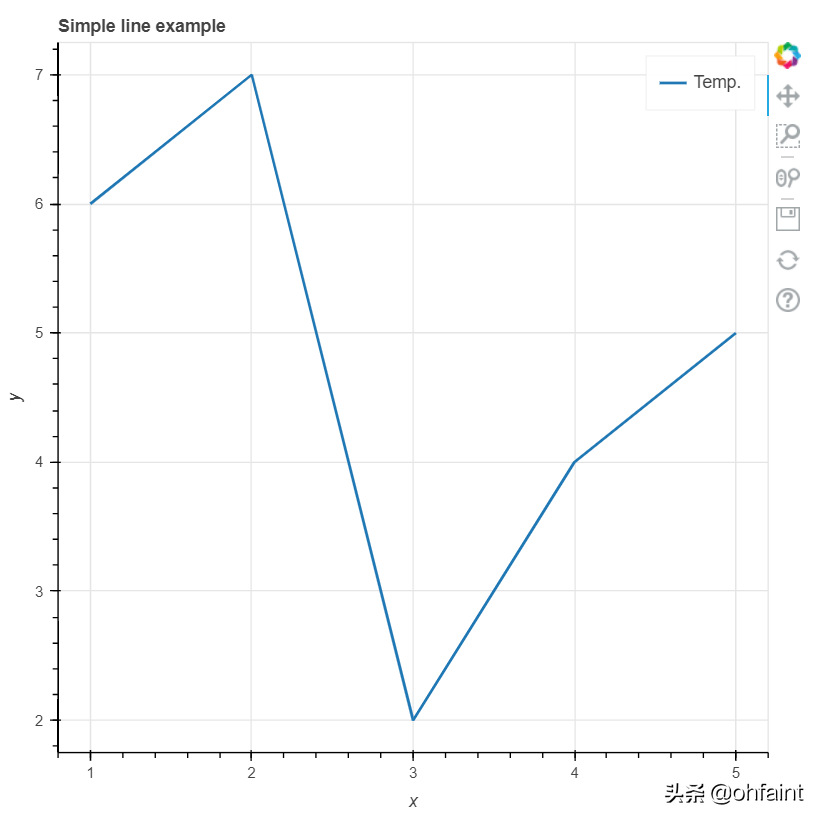
x = [1, 2, 3, 4, 5]
y = [6, 7, 2, 4, 5]
Step3:使用函数figure()创建一个显示对象p
# create a new plot with a title and axis labels
p = figure(title="Simple line example", x_axis_label='x', y_axis_label='y')
其中:
- title:表示图的题名 (可选)
- x_axis_label:表示x轴上显示的字符 (可选)
- y_axis_label:表示y轴上显示的字符(可选)
Step4:使用函数line()在显示对象p中增加一个折线图
# add a line renderer with legend and line thickness to the plot
p.line(x, y, legend_label="Temp.", line_width=2)
其中:
- x、y:为要显示的数据;
- legend_label:设置图例 (可选)
- line_width:定义线宽(单位像素)(可选)
Step5:使用show()函数创建图形并启动一个web浏览器显示生成的HTML文件
# show the results
show(p)
执行以上代码的时候Bokeh创建一个lines.html的输出文件并打开一个浏览器来显示该文件。
PS:以上显示语句会打开一个新的浏览器窗口显示折线图。如果希望图形依然显示在编辑窗口中,那么需要修改以下2处:
-
需要在程序开始引入函数output_notebook()
from bokeh.plotting import output_notebook -
在创建图形对象p之前调用该函数 output_notebook()