串联排队系统是一种常见的排队系统结构,由多个单一排队系统按照特定的顺序连接而成。在串联排队系统中,一个排队系统的输出将成为下一个排队系统的输入,从而形成连续的流程。这种系统结构可以用于模拟和优化许多现实世界中的流程,如生产线、物流运输等。

一、双服务台串联排队系统模型结构
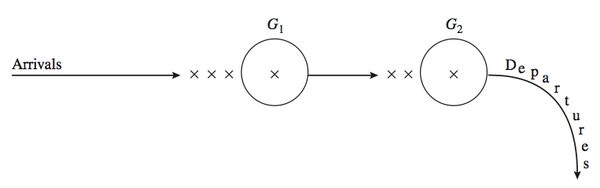
双服务台排队串联模型:假设顾客按照密度为\(\lambda(t),t>0\) 非齐次泊松过程到达某服务站接受服务,服务站有两个服务台1和2,顾客先先到服务台1接受服务,然后再到服务台2接受服务。若顾客到达服务站时且服务台1处于闲期,则直接到服务台1接受服务,若服务台1处于忙期,则排队等候。顾客在服务台1接受服务结束后,则到达服务台2。若服务台2处于闲期,则顾客直接到服务台2接受服务,若服务台2处于忙期,则排队等候接受。两个服务台有顾客排队,则按照先到先服务的原则进行服务;如果服务台空无一人,服务台就处于闲期直到下一个顾客到达进行服务。顾客接受完服务台2的服务后,就离开服务系统。其排队系统模型结构参看下图。

假设服务台1和2对一名顾客服务的时间为随机变量且分布为\(G_1,G_2\)。假设 \(T\)为一个固定时间,\(T\)时刻后不再接受顾客进入系统,但对系统中剩余顾客仍进行服务,直到对所有顾客服务完为止。
二、供应链订单排队系统
排队论在供应链订单仿真分析中的应用可以帮助评估和改进供应链的订单处理流程、服务水平和效率。通过建立排队模型和进行仿真分析,可以揭示订单处理过程中的瓶颈和拥堵问题,并提供优化策略。以下是一些供应链订单仿真分析中排队论的应用示例:
评估订单处理时间:排队论可以用于评估订单在供应链中的处理时间。通过模拟订单的到达率、处理时间和服务能力,可以分析订单处理过程中的等待时间、延误和效率。这有助于确定订单处理的瓶颈环节,优化资源分配和提高订单处理速度。
预测订单满足率:排队论可以应用于预测订单满足率。通过模拟订单到达率和处理能力,可以评估不同情况下的订单满足率和交付时间。这有助于制定合理的订单接受和处理策略,以提高供应链的客户满意度和交付准时率。
优化订单处理策略:排队论可以帮助优化订单处理策略。通过仿真分析不同的订单处理策略,如先进先出、优先级排序等,可以评估它们对订单处理时间、等待时间和服务水平的影响。这有助于制定最佳的订单处理策略,以提高供应链的效率和客户体验。
评估订单处理能力:排队论可以用于评估供应链中的订单处理能力。通过仿真分析不同的订单到达率和处理能力,可以确定供应链在不同负荷条件下的性能和瓶颈。这有助于决策者评估供应链的承载能力,制定资源投入和扩展计划。
模拟供应链变化和改进效果:排队论可以用于模拟供应链的变化和改进效果。通过建立基准模型和改进方案模型,可以比较不同方案对订单处理时间、等待时间和服务水平的影响。这有助于决策者评估改进措施的可行性和效果,以做出有根据的决策。
三、双服务台串联排队仿真
简要来说,仿真是在纯数学建模和实际系统的优缺点之间的⼀个折中。相对数学模型来说,仿真不需要⾼深的数学技巧,也不需要作过多的简化和假设,并且在求解复杂系统时,不会⾯对状态和空间爆炸的问题。仿真可以⽤来验证数学模型的正确性,而相比实际系统,仿真的成本要⼩得多,并且容易取得更多的统计信息。这里着重考虑两个等待制服务台的串联排队系统模型。针对输入过程为泊松分布,两个服务台的服务时间都服从指数分布的特殊模型,前人已经根据生灭过程理论得到了队长的平稳概率分布。
供应链订单处理涵盖了从订单生成到交付的全过程,包括订单确认、库存管理、生产调度、物流配送等环节,如下图所示。这个流程能确保订单能够高效、准确地处理,满足客户需求,提升供应链的运作效率和响应能力。通过有效的供应链订单流处理,企业可以减少库存积压、降低运营成本、提升客户满意度。

订单确认和订单履行是两个核心的处理环节,订单验证通过后,系统会向客户发送订单确认信息,包括订单号、总价和预计交付时间等,客户需要确认订单信息并进行支付;订单履行涉及到分拣和打包产品以备发货的工作。现某网上商城订单处理的主要流程如下:网上支付成功后的顾客订单列到达的时间间隔服从均值为0.5分钟的负指数分布,订单确认时间服从均值为1分钟的负指数分析;商城采用单一订单分配存货,安排拣货及发货等采用公司软件辅助处理,拣选中心根据实时传送的拣货单进行拣货,订单履行时间平均每单大约4.5分钟。现商城共有工作人员5位,如何安排能使商城处理订单的效率最高?该商城4小时工作时间最多可外理多少订单?
import simpy
import numpy as np
import csv

def negative_exponential(rate):
    return np.random.exponential(scale=1/rate)

def customer(env, server1, server2, mu1, mu2, arrival_times, waiting_times_at_station1, service_times_at_station1, service_end_times_at_station1, waiting_times_at_station2, service_times_at_station2, service_end_times_at_station2, total_waiting_times):
    arrival_time = env.now

    with server1.request() as request1:
        yield request1
        waiting_time1 = env.now - arrival_time
        service_time1 = negative_exponential(mu1)
        yield env.timeout(service_time1)

        with server2.request() as request2:
            yield request2
            waiting_time2 = env.now - (arrival_time + waiting_time1 + service_time1)
            service_time2 = negative_exponential(mu2)
            yield env.timeout(service_time2)

            total_waiting_time = waiting_time1 + waiting_time2
            service_end_time = env.now
            yield env.timeout(service_time2)

            arrival_times.append(arrival_time)
            waiting_times_at_station1.append(waiting_time1)
            service_times_at_station1.append(service_time1)
            service_end_times_at_station1.append(service_end_time - service_time1)
            waiting_times_at_station2.append(waiting_time2)
            service_times_at_station2.append(service_time2)
            service_end_times_at_station2.append(service_end_time)
            total_waiting_times.append(total_waiting_time)

def simulate_queue_system(lambda1, mu1, mu2, station1_count, station2_count, simulation_time):
    arrival_times = []
    waiting_times_at_station1 = []
    service_times_at_station1 = []
    service_end_times_at_station1 = []
    waiting_times_at_station2 = []
    service_times_at_station2 = []
    service_end_times_at_station2 = []
    total_waiting_times = []

    env = simpy.Environment()
    server1 = simpy.Resource(env, capacity=station1_count)
    server2 = simpy.Resource(env, capacity=station2_count)

    def generate_customers():
        while True:
            yield env.timeout(negative_exponential(lambda1))
            env.process(customer(env, server1, server2, mu1, mu2, arrival_times, waiting_times_at_station1, service_times_at_station1, service_end_times_at_station1, waiting_times_at_station2, service_times_at_station2, service_end_times_at_station2, total_waiting_times))

    env.process(generate_customers())
    env.run(until=simulation_time)

    return list(zip(arrival_times, waiting_times_at_station1, service_times_at_station1, service_end_times_at_station1, waiting_times_at_station2, service_times_at_station2, service_end_times_at_station2, total_waiting_times))

# Set parameters
lambda1 = 2  # Arrival rate parameter for negative exponential distribution
mu1 = 1  # Service rate parameter at station 1 for negative exponential distribution

# Get station counts from user input
station1_count = int(input("Enter the number of stations at Station 1: "))
station2_count = int(input("Enter the number of stations at Station 2: "))

mu2 = 4.5  # Service rate parameter at station 2 for negative exponential distribution
simulation_time = 240  # Simulation time in minutes

# Run simulation
simulation_results = simulate_queue_system(lambda1, mu1, mu2, station1_count, station2_count, simulation_time)

# Write results to a CSV file
with open('hh.csv', 'w', newline='') as csvfile:
    writer = csv.writer(csvfile)
    writer.writerow(["Arrival Time", "Waiting Time (Station 1)", "Service Time (Station 1)", "Service End Time (Station 1)",
                     "Waiting Time (Station 2)", "Service Time (Station 2)", "Service End Time (Station 2)",
                     "Total Waiting Time (System)"])
    for result in simulation_results:
        writer.writerow(result)

# Calculate total number of customers
total_customers = len(simulation_results)

# Calculate average total waiting time
average_total_waiting_time = np.mean([result[7] for result in simulation_results if not np.isnan(result[7])])

# Calculate average system time
average_system_time = np.mean([result[7] + result[5] + result[4] for result in simulation_results if not np.isnan(result[7])])

# Calculate average time in system
average_system_waiting_time = np.mean([result[1] + result[4] for result in simulation_results if not np.isnan(result[7])])

# Print additional results
print("Total Customers:", total_customers)
print("Average System Time:", round(average_system_time, 2) if not np.isnan(average_system_time) else 0)
print("Average System Waiting Time:", round(average_system_waiting_time, 2) if not np.isnan(average_system_waiting_time) else 0)
Enter the number of stations at Station 1: 2    #从键盘输入第一站服务台数量
Enter the number of stations at Station 2: 3    #从键盘输入第二站服务台数量
Total Customers: 354                            #完成服务订单量
Average System Time: 27.18                      #平均逗留时间
Average System Waiting Time: 26.97              #平均排队等待时间

Enter the number of stations at Station 1: 3
Enter the number of stations at Station 2: 2
Total Customers: 482
Average System Time: 4.12
Average System Waiting Time: 3.87
5个工作人员最优分配为第一站3人第二站2人工作效率最高。通过模拟排队仿真解决了订单子系统的工作分配问题,当然所有数据都是模拟的,其精度还要测试和调整,不过已可管中窥豹了。