001、基础绘图
library(ggplot2)
p <- ggplot(data.frame())+geom_point()+xlim(0,10)+ylim(0,10)       ## 基础绘图
p
002、增加文本
an1 <- p + annotate("text", x = 5, y = 5, label = "Some text")      ## 增加文本
an1

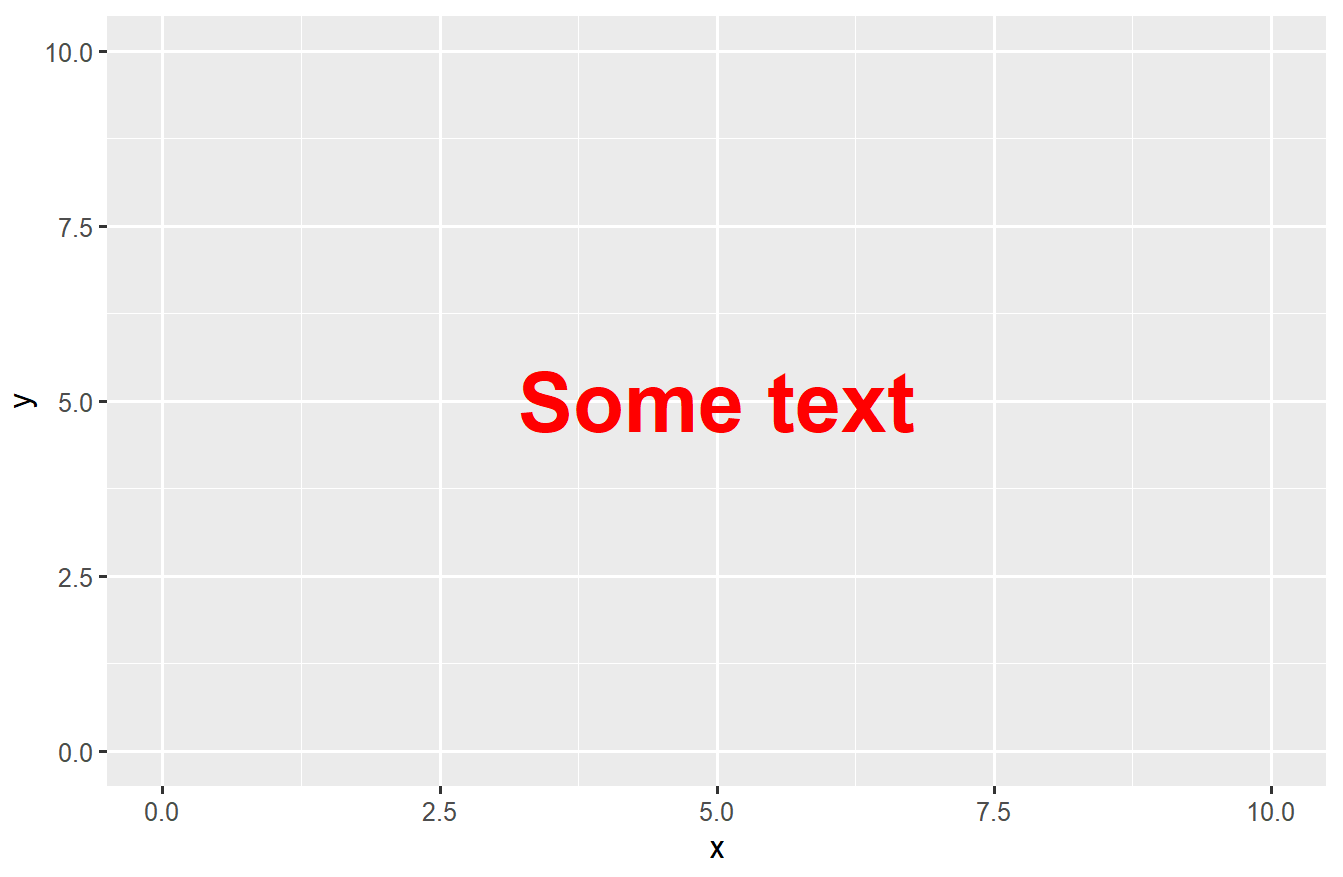
003、修改颜色、字体、大小等;
aaa <- p + annotate("text", x = 5, y = 5, label = "Some text",
                    cex = 10, col = "red", fontface = 2)       ## 修改大小, 颜泽, 字体
aaa
004、同时增加多个图标
an2 <- p + annotate("text", x = 2:5, y = 5, label = "a")     ## 同时增加多个图标
an2

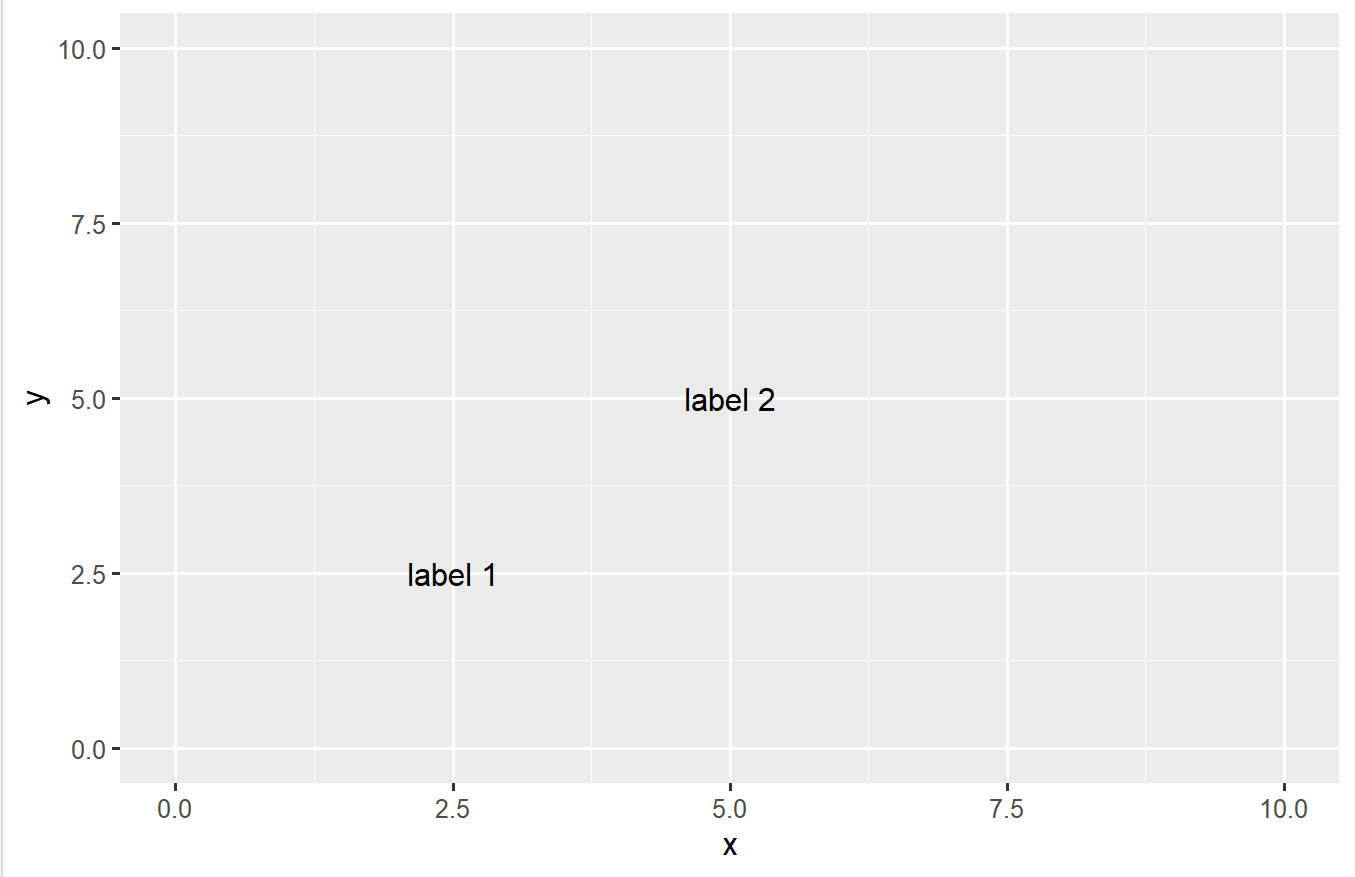
005、同时增加多个图标
an3 <- p + annotate("text", x = c(2.5,5), y = c(2.5,5),
                    label = c("label 1", "label 2"))        ## 同时增加多个图标
an3
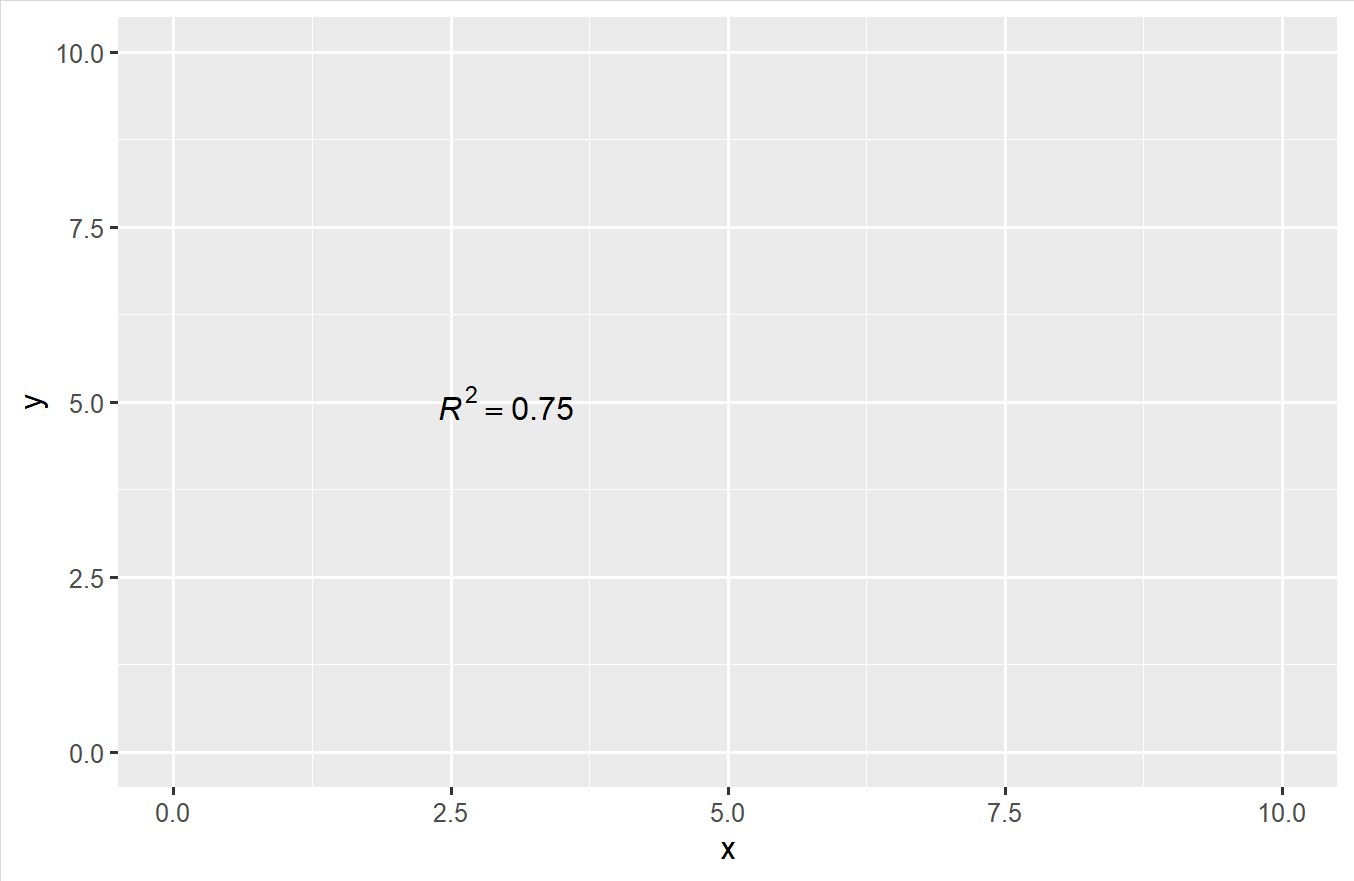
006、增加数学公式
an4 <- p + annotate("text", x = 3, y = 5,
label = "italic(R) ^ 2 == 0.75", parse = TRUE)      ## 增加数学公式
an4
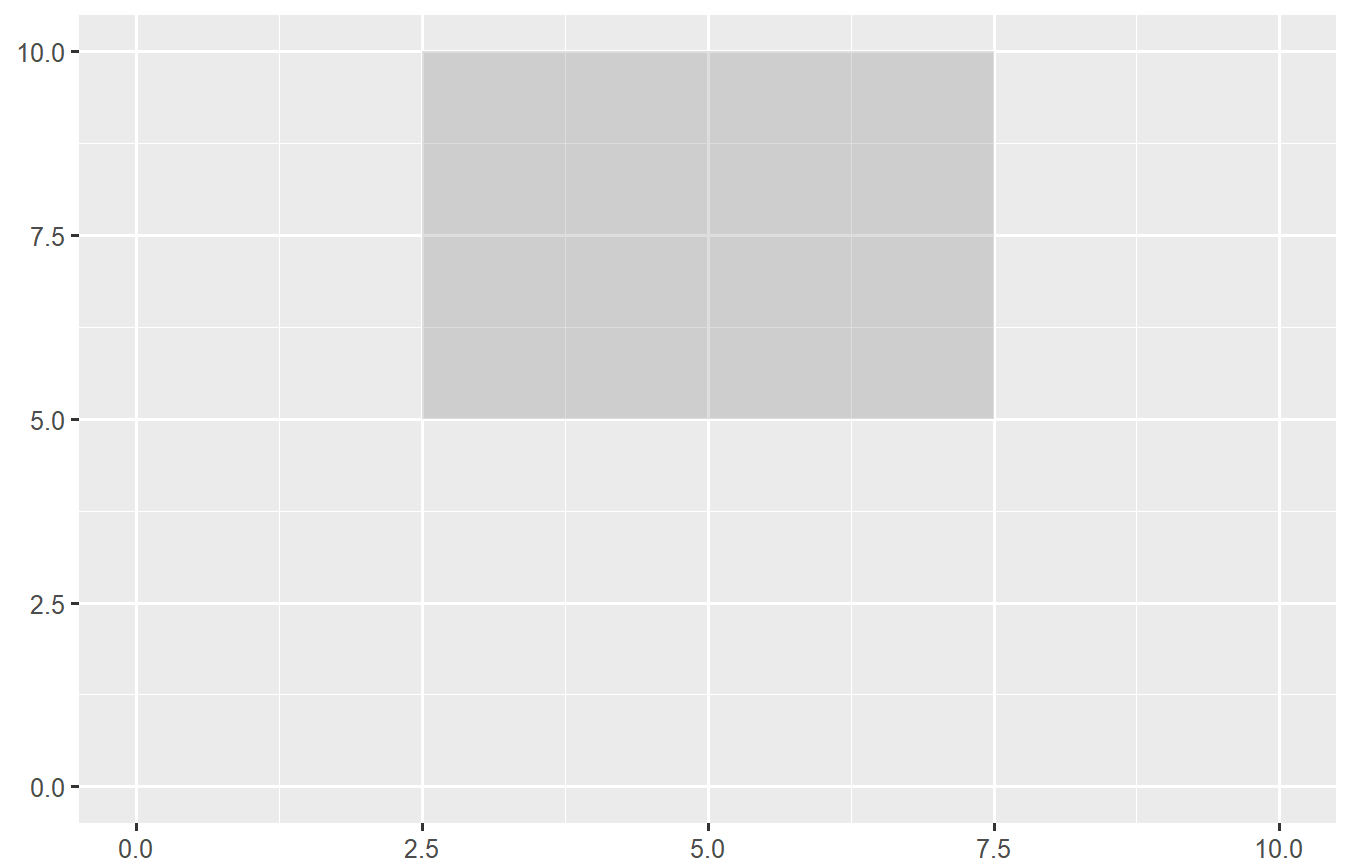
007、增加矩形
an5 <- p + annotate("rect", xmin = 2.5, xmax = 7.5,
      ymin = 5, ymax = 10, alpha = .2)         ## 增加矩形,并设置透明度
an5
008、增加矩形,调整颜色,调整透明度
aa <- p + annotate("rect", xmin = 2.5, xmax = 7.5,        ## 增加矩形,调整颜色, 调整透明度
            fill = "red", col = "red",ymin = 5, ymax = 10, alpha = .4)
aa

009、增加线段
an6 <- p + annotate("segment", x = 2.5, xend = 7.5, y = 2.5, yend = 5,
                    colour = "blue")      ## 增加线段
an6

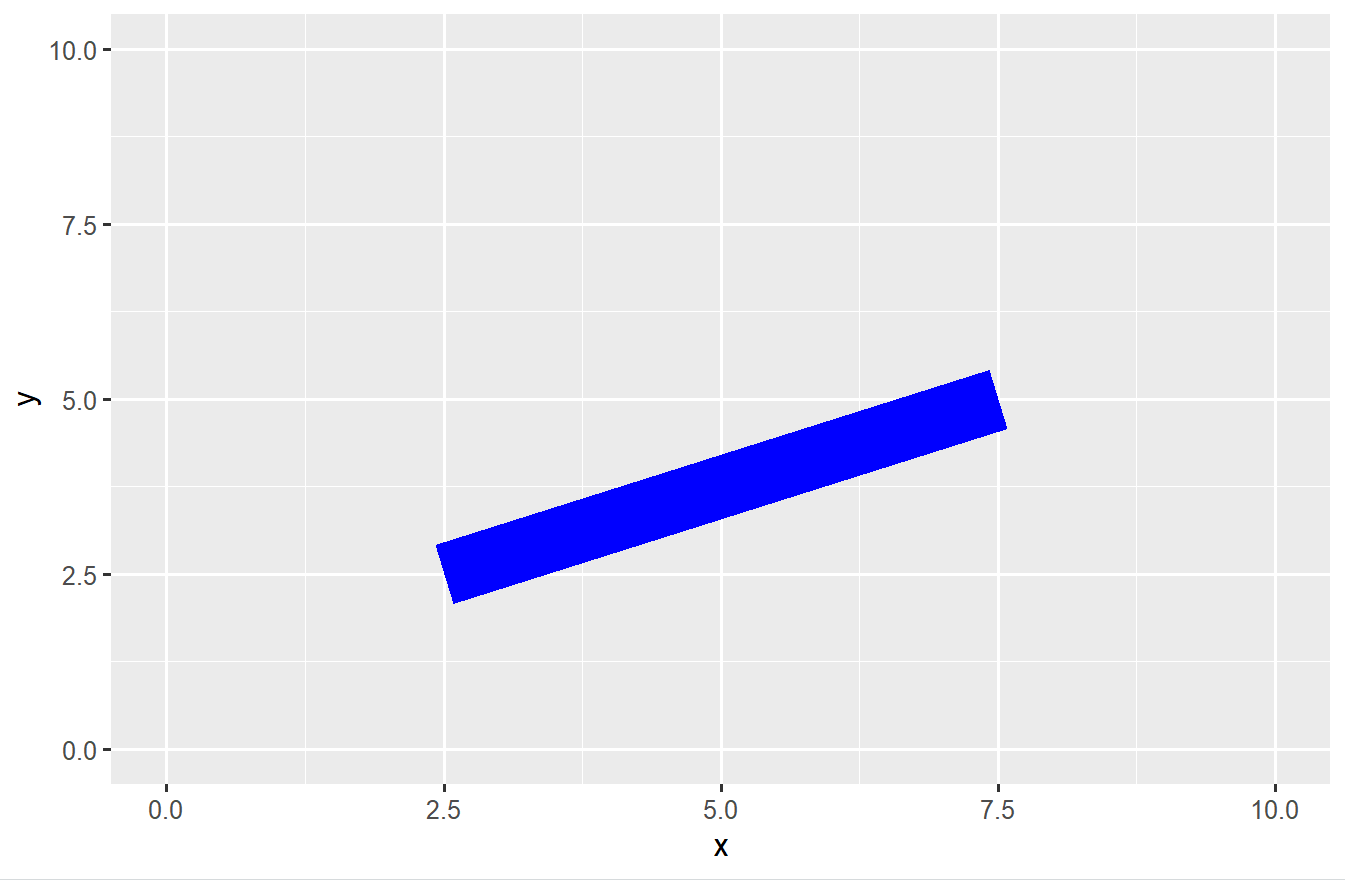
010、调整线段的宽度
an6 <- p + annotate("segment", x = 2.5, xend = 7.5, y = 2.5, yend = 5,
                    colour = "blue", lwd = 10)     ## 调整线段的宽度
an6