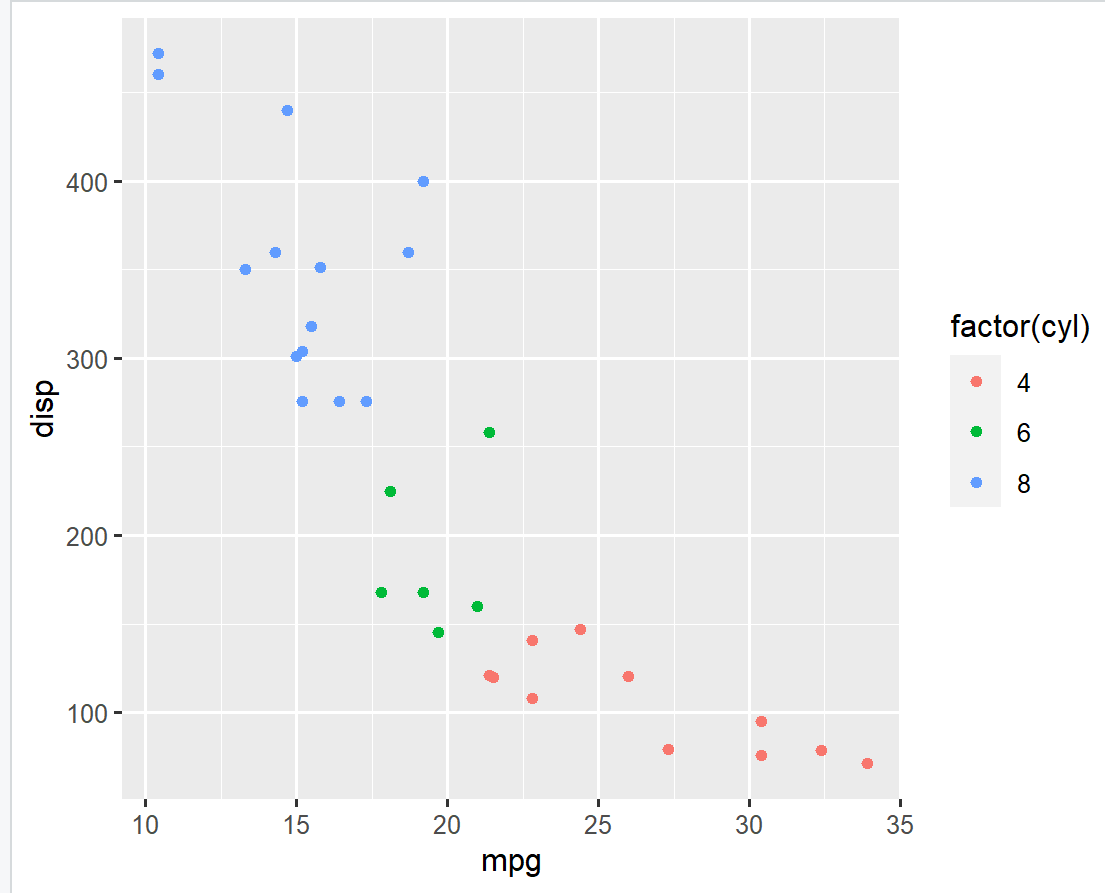
001、基础绘图
ggplot(data=mtcars, aes(x=mpg, y=disp,
  color=factor(cyl))) + geom_point()            ## 基础绘图
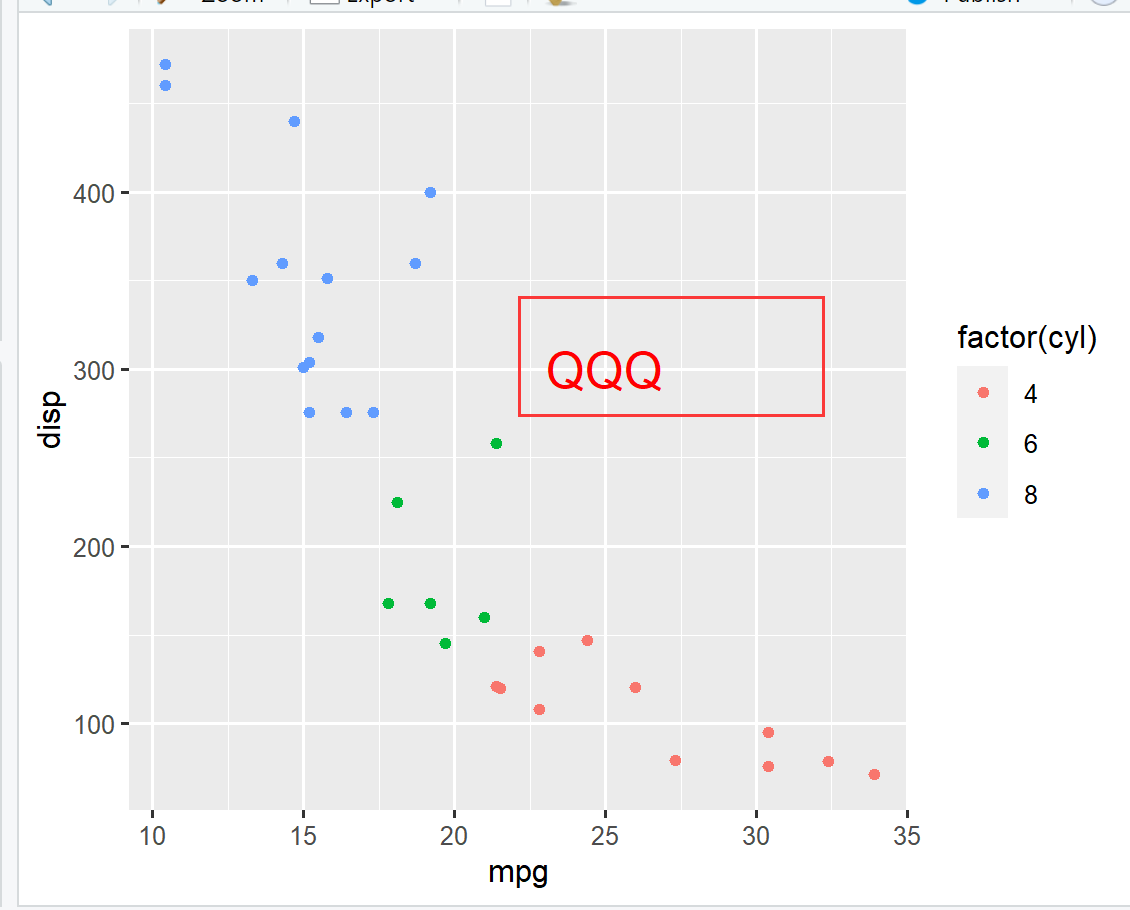
002、annotete在任意位置增加注释
ggplot(data=mtcars, aes(x=mpg, y=disp,      ## 在坐标, 25, 300处增加QQ
  color=factor(cyl))) + geom_point() +
annotate("text", label = "QQQ", x = 25, y = 300, size=6, col = "red")
。