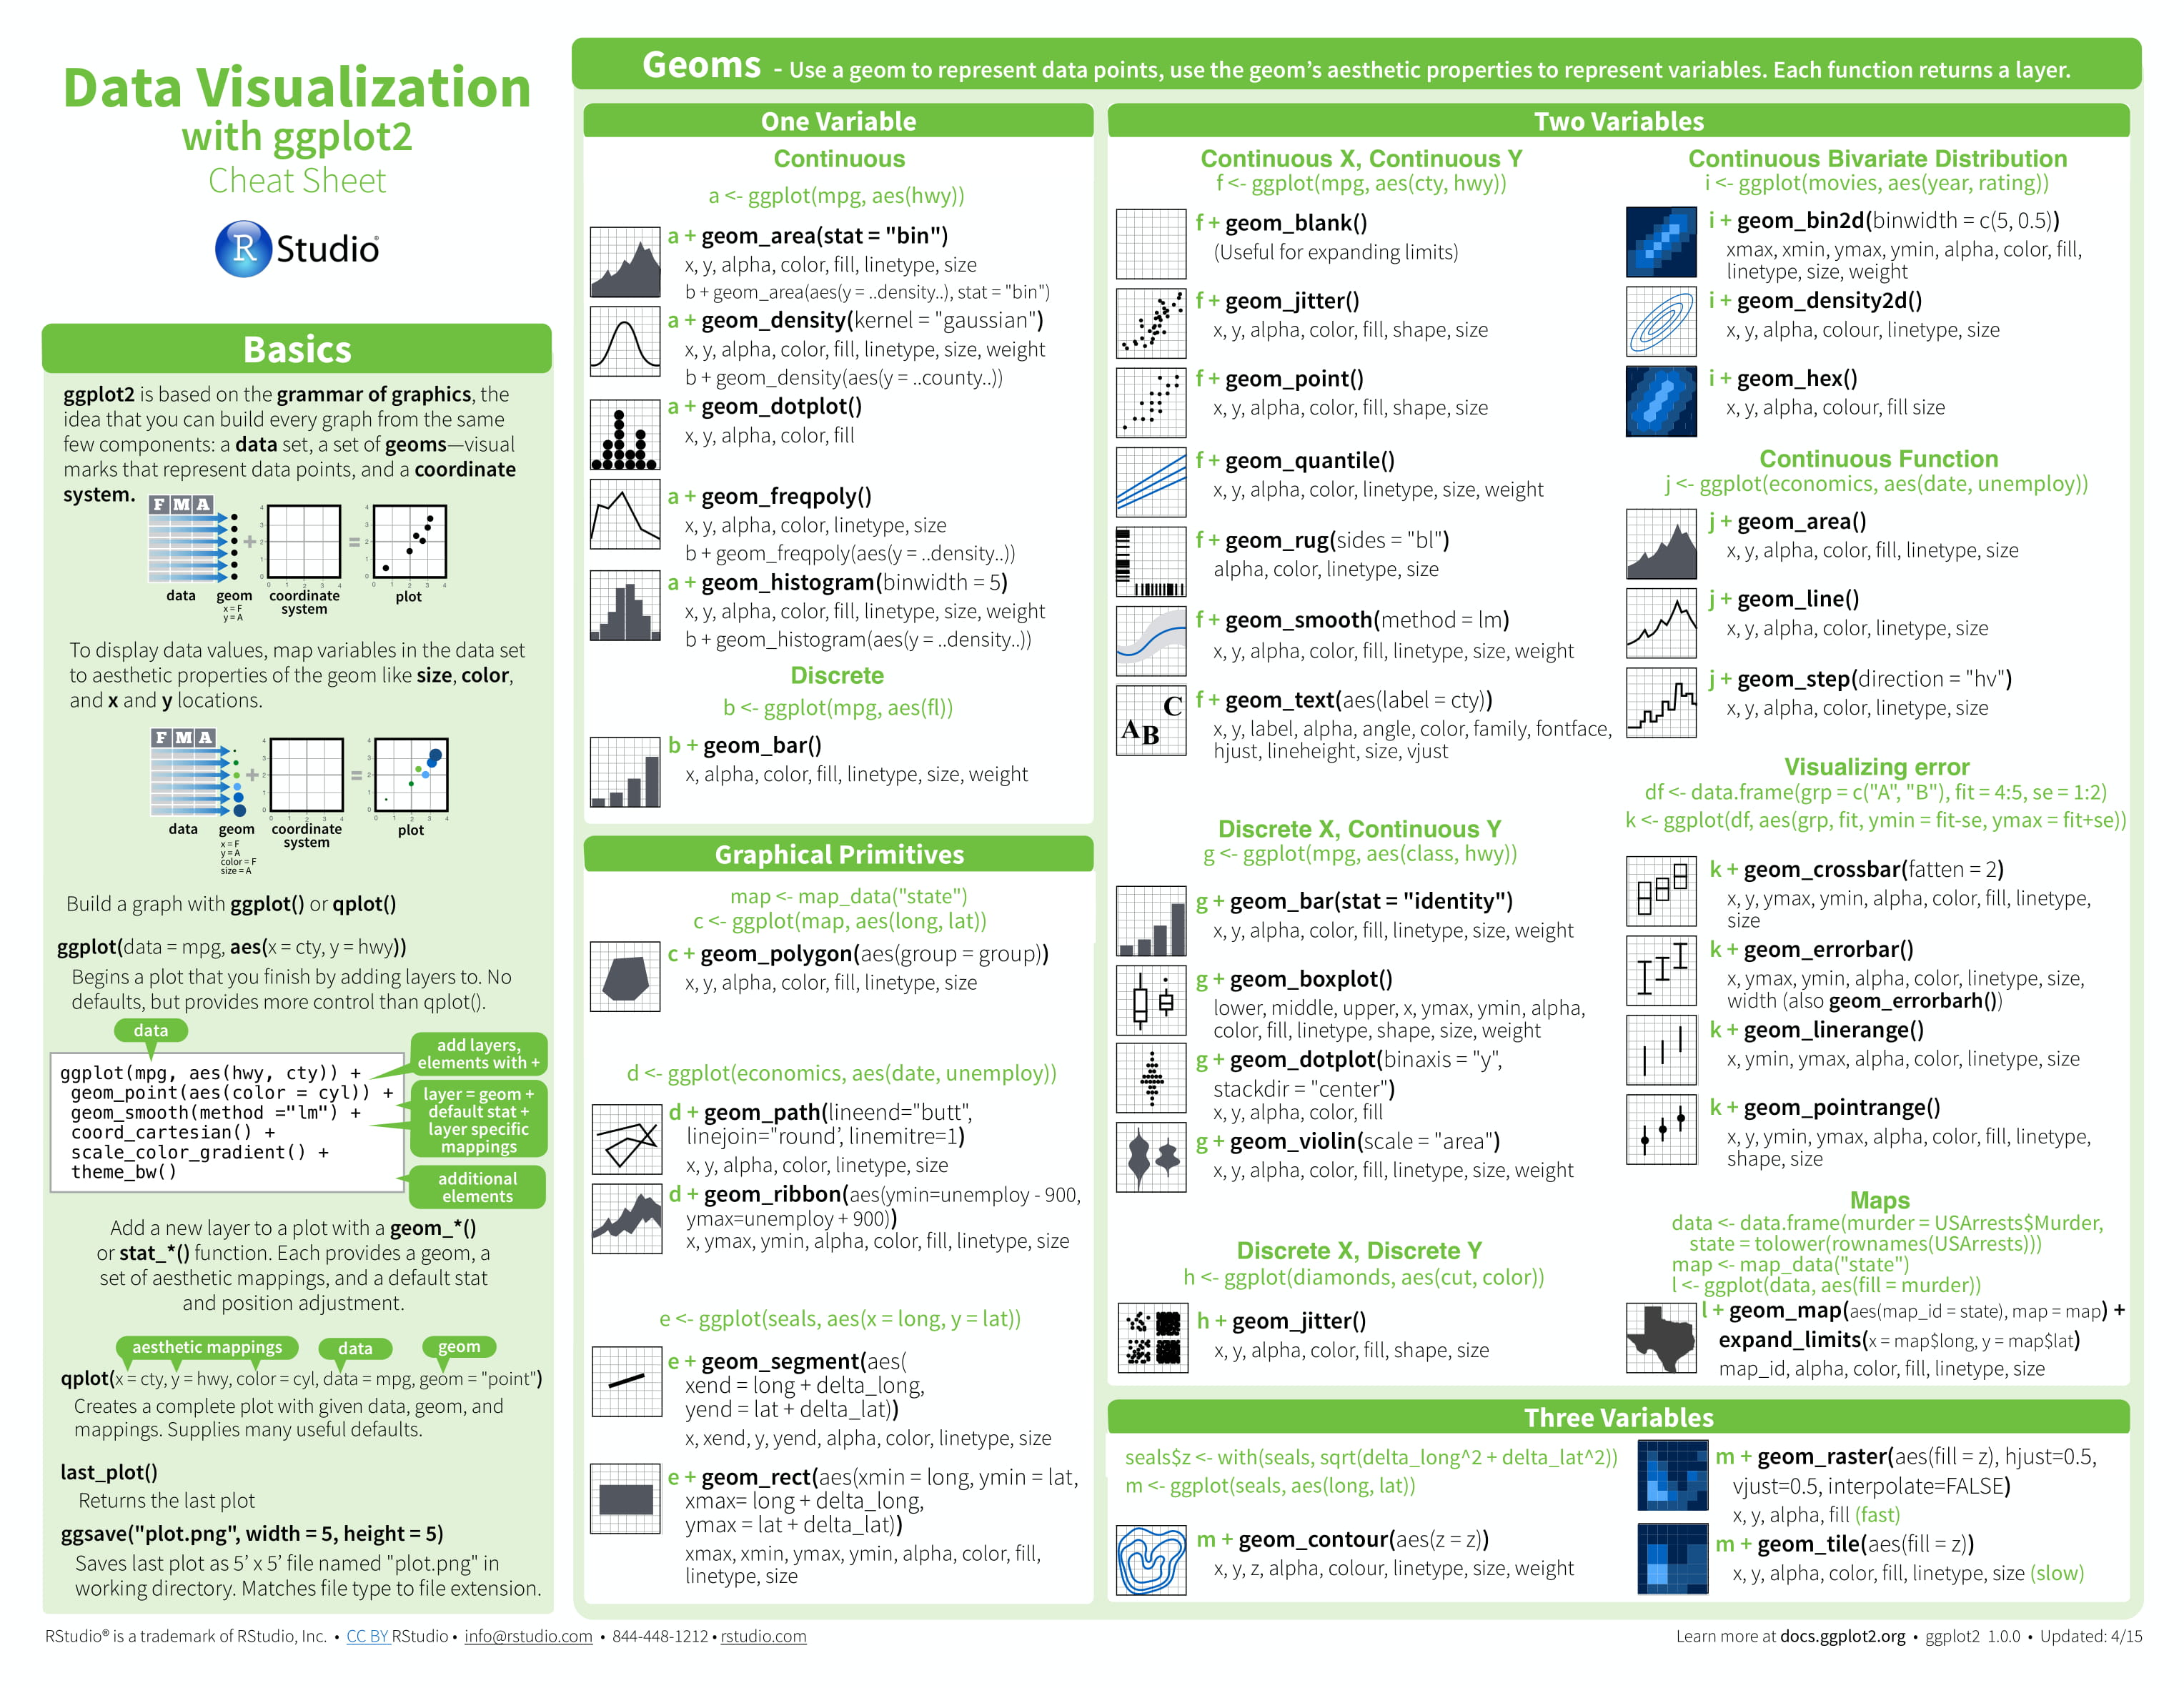
ggplot2
ggplot2 绘图 x轴标签顺序
001、测试数据及绘图 x <- c("B","A","D","C","E") ## 测试数据顺序 y <- c(5,6,7,8,9) df <- data.frame(x = x , y = y) df library("ggplot2") ggplot(data=df,aes(x=x,y=y)) ......
ggplot2 中绘图清空 x轴或者y轴的title
001、基础绘图 library(ggplot2) p <- ggplot(faithful, aes(x = eruptions, y = waiting)) + geom_point() p 02、清空x轴title p + theme(axis.title.x =element_blank() ......
ggplot2 中 绘图调整刻度线标签的长度
001、基础绘图 library(ggplot2) p <- ggplot(faithful, aes(x = eruptions, y = waiting)) + geom_point() p ## 基础绘图 02、调整刻度线标签的长度 p + theme(axis.ticks.length = ......
ggplot2中单独增加某条边框的粗细
001、 library(ggplot2) p<-ggplot(mtcars,aes(mpg,hp,colour=factor(cyl)))+geom_point() p p+theme(axis.line.x=element_line(linetype=1,color="black",size=0 ......
ggplot2中手动调整颜色
001、基础绘图 ggplot(data=mtcars, aes(x=mpg, y=disp, color=factor(cyl))) + geom_point() 02、手动调整颜色 ggplot(data=mtcars, aes(x=mpg, y=disp, color=factor(cyl)) ......
R语言绘图命令(含ggplot2)
#绘图:初级绘图、中级绘图、ggplot2高级绘图#笔记包含内容: #《R语言实战》:第6章基本图形、第11章中级绘图、第19章ggplot高级绘图# 一、第6章基本方法之基本图形 #plot绘制####plot(mtcars$mpg) #默认散点图plot(mtcars$mpg,mtcars$wt ......
ggplot2 Manhattan Plots
最经典的一种genome wide图形,可以显示全基因组的hit。 GWAS的数据 需要里面的Chr,start,bp_cum,以及最核心的p-value。 我准备的CRIPSR screen数据。 参考: How I Create Manhattan Plots Using ggplot http ......
ggplot2参考手册
ggplot2画图的手卡:   library(dplyr) ## 依次生成测试子图p1、p2、p3、p4 p1 <- ggplot(mpg) + geom_point(aes(x = displ, y = hwy)) + ggtitle("P1") p2 <- ggplot ......
ggplot2中实现多个绘图在一张画布中组合
001、生成几个测试数据 library(ggplot2) library(dplyr) p1 <- ggplot(mpg) + geom_point(aes(x = displ, y = hwy)) + ggtitle("P1") ## 测试图p1 p2 <- ggplot(mpg) + geom ......
ggplot2中修改图例的位置
001、默认绘图 bp <- ggplot(PlantGrowth, aes(x=group, y=weight, fill=group)) + geom_boxplot() ## 绘图 bp ## 输出图片 002、上部 bp + theme(legend.position="top") ## 放 ......
ggplot2绘图中修改图例的标题
001、正常绘图 library(ggplot2) bp <- ggplot(data=PlantGrowth, aes(x=group, y=weight, fill=group)) + geom_boxplot() bp ## 显示绘图结果 002、修改图例标题的名称 bp + scale_fi ......
ggplot2绘图中隐藏图例标题
001、正常绘图,显示图例 library(ggplot2) bp <- ggplot(data=PlantGrowth, aes(x=group, y=weight, fill=group)) + geom_boxplot() ## 绘图 bp ## 显示绘图 绘图结果如下: 002、隐藏图例的标 ......
ggplot2中绘图修改图例的顺序
001、直接绘图效果: library(ggplot2) bp <- ggplot(data=PlantGrowth, aes(x=group, y=weight, fill=group)) + geom_boxplot() ## 绘图 bp ## 显示绘图结果 绘图结果如下: 002、修改图例显示 ......
ggplot2绘图中移除图例
001、 a、利用测试数据绘制箱线图 library(ggplot2) bp <- ggplot(data=PlantGrowth, aes(x=group, y=weight, fill=group)) + geom_boxplot() ## 绘图 bp ## 显示绘图结果 绘图结果如下: b、移 ......
ggplot2中设置标签刻度的粗细和长度
001、使用绘制散点图进行测试。 a、直接绘制散点图 x <- 1:10 y <- seq(1, 1000, 100) dat <- data.frame(x, y) ## 生成测试数据 ggplot(dat, aes(x, y)) + geom_point() ## 直接绘制散点图 绘图结果如下: ......
ggplot2中使用对数坐标轴
001、 利用绘制散点图进行测试 a、直接绘制散点图 x <- 1:10 y <- seq(1, 1000, 100) dat <- data.frame(x, y) ## 生成测试数据 ggplot(dat, aes(x, y)) + geom_point() ## 直接绘制散点图 绘图结果如下: ......
ggplot2中去除背景网格、背景颜色、边框
001、theme_classic() 主题用来去除背景 a、使用默认的背景 type <- c('A', 'B', 'C', 'D', 'E', 'F', 'G') nums <- c(10,23,8,33,12,40,60) df <- data.frame(type = type, nums ......
R语言中ggplot2绘制柱状图
001、 基础绘图 type <- c('A', 'B', 'C', 'D', 'E', 'F', 'G') nums <- c(10,23,8,33,12,40,60) df <- data.frame(type = type, nums = nums) ## 生成的测试数据框 df ggplot ......